Directional Volume IndexDirectional Volume Index (DVI) (buying/selling pressure)
This index is adapted from the Directional Movement Index (DMI), but based on volume instead of price movements. The idea is to detect building directional volume indicating a growing amount of orders that will eventually cause the price to follow. (DVI is not displayed by default)
The rough algorithm for the Positive Directional Volume Index (green bar):
calculate the delta to the previous green bar's volume
if the delta is positive (growing buying pressure) add it to an SMA, else add 0 (also for red bars)
divide these average deltas by the average volume
the result is the Positive Directional Volume Index (DVI+) (vice versa for DVI-)
Differential Directional Volume Index (DDVI) (relative pressure)
Creating the difference of both Directional Volume Indexes (DVI+ - DVI-) creates the Differential Directional Volume Index (DDVI) with rising values indicating a growing buying pressure, falling values a growing selling pressure. (DDVI is displayed by default, smoothed by a custom moving average)
Average Directional Volume Index (ADVX) (pressure strength)
Putting the relative pressure (DDVI) in relation to the total pressure (DVI+ + DVI-) we can determine the strength and duration of the currently building volume change / trend. For the DMI/ADX usually 20 is an indicator for a strong trend, values above 50 suggesting exhaustion and approaching reversals. (ADVX is not displayed by default, smoothed by a custom moving average)
Divergences of the Differential Directional Volume Index (DDVI) (imbalances)
By detecting divergences we can detect situations where e.g. bullish volume starts to build while price is in a downtrend, suggesting that there is growing buying pressure indicating an imminent bullish pullback/order block or reversal. (strong and hidden divergences are displayed by default)
Divergences Overview:
strong bull: higher lows on volume, lower lows on price
medium bull: higher lows on volume, equal lows on price
weak bull: equal lows on volume, lower lows on price
hidden bull: lower lows on volume, higher lows on price
strong bear: lower highs on volume, higher highs on price
medium bear: lower highs on volume, equal highs on price
weak bear: equal highs on volume, higher highs on price
hidden bear: higher highs on volume, lower highs on price
DDVI Bands (dynamic overbought/oversold levels)
Using Bollinger Bands with DDVI as source we receive an averaged relative pressure with stdev band offsets. This can be used as dynamic overbought/oversold levels indicating reversals on sharp crossovers.
Alerts
As of now there are no alerts built in, but all internal data is exposed via plot and plotshape functions, so it can be used for custom crossover conditions in the alert dialog. This is still a personal research project, so if you find good setups, please let me know.
Cari dalam skrip untuk "Buy sell"

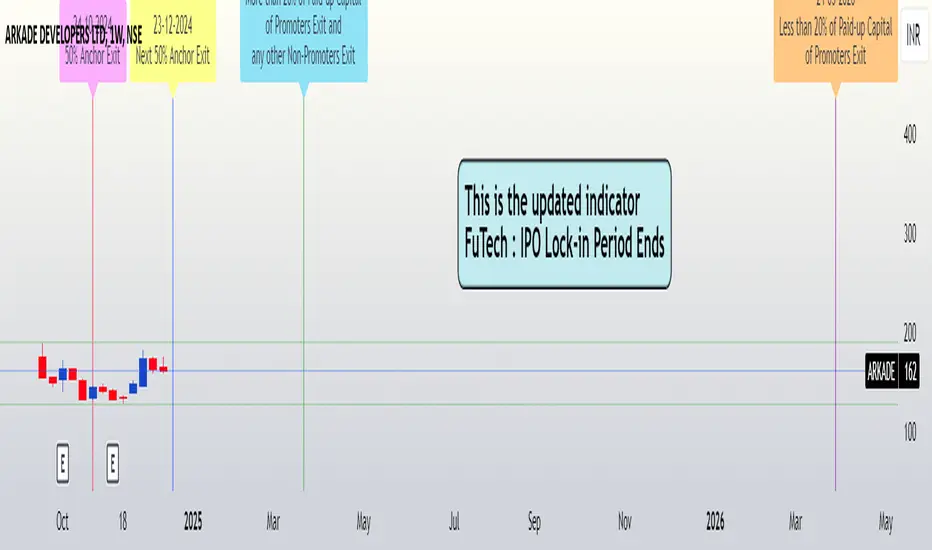
FuTech : IPO Lock-in Ends FuTech: Lock-in Ends - First ever unique Indicator on the TradingView platform
Hello Everyone !
Introducing the first-ever unique indicator on the TradingView platform to track the lock-in period expiry dates for IPOs.
The FuTech Lock-in Ends Indicator is specifically designed to assist traders and investors in identifying the key dates when lock-in periods for IPO shares come to an end.
This provides an edge in preparing for potential market movements driven by buying or selling pressures associated with significant share volumes.
=============================================================
Key Features:
1. Tracks Multiple Lock-in Periods:
- Identifies dates when the 30 days, 90 days, 6 months, and 18 months lock-in periods for IPO shares expire.
- Helps traders anticipate potential market action driven by share releases.
2. IPO Lock-in Ends dates as per Compliance with SEBI Guidelines:
- SEBI (Securities and Exchange Board of India) mandates lock-in periods for IPO shares based on investor categories:
- A) Promoters:
- Lock-in period reduced to 18 months for up to 20% of post-issue paid-up capital (previously 3 years).
- For shareholding exceeding 20%, the lock-in period is further reduced to 6 months (previously 1 year).
- B) Anchor Investors:
- 50% of allotted shares: Lock-in period of 90 days from the date of allotment.
- Remaining 50% of shares: Lock-in period of 30 days from the date of allotment.
- C) Non-promoters:
- Lock-in period reduced to 6 months (previously 1 year).
After these lock-in periods end, investors may buy / sell their shares, which can result in significant market activity.
3. Visual Indicator on Charts:
- The indicator draws vertical lines on the TradingView chart at the respective lock-in expiry dates.
- Alerts users in advance about potential market activity due to the release of locked shares.
- Traders can use these alerts to prepare for positions or adjust their existing holdings accordingly.
4. Customizable Settings:
- Users can modify the color of the labels and width of the lines to suit their preferences and enhance chart visibility.
5. User-defined Allotment Dates:
- If the allotment date is known, users can input this information directly. The indicator will then calculate the lock-in period dates based on the provided allotment date, ensuring precise results.
- If no allotment date is entered, the default calculation assumes the allotment date to be three trading days prior to the listing date .
=============================================================
Important Notes:
- Allotment Date Calculation:
- In the absence of user-defined allotment dates, the indicator estimates the allotment date as three trading days prior to the listing date .
- This approximation may deviate by one to two days from the actual event for certain IPOs.
- Proactive Alerts:
- Most dates are intentionally marked 1-2 days in advance to give traders sufficient time to act, whether for taking new positions or squaring off existing ones to avoid unfavorable losses.
=============================================================
The FuTech Lock-in Ends Indicator is a must-have tool for IPO traders and investors looking to stay ahead of market movements. Use it to track key dates and plan your trading strategy effectively with FuTech : Chart is Art.
=============================================================
Thank you !
Jai Swaminarayan Dasna Das !
He Hari ! Bas Ek Tu Raji Tha !
[blackcat] L1 Banker Move█ OVERVIEW
The Pine Script is an indicator designed to analyze market signals for institutional and short-term investors. It calculates and plots three main signals: Institutional Signal, Institutional Build, and Short-Term Investor Signal. The script uses a combination of price, volume, and moving average data to generate these signals, which can help traders identify potential buying or selling opportunities.
█ LOGICAL FRAMEWORK
The script is structured into several main sections:
1 — Input Parameters
The script does not explicitly define any input parameters, relying on default values for calculations.
2 — Custom Functions
• reference_value(values, length) : Retrieves the first non-NA value from a specified number of past values.
• calculate_institutional_and_short_term_signals(low, close, open, volume) : Calculates the institutional and short-term investor signals based on price, volume, and moving average data.
3 — Calculations
• Price and Volume Metrics: The script calculates various smoothed price changes, lowest and highest values over different periods, and volume-weighted prices.
• Moving Averages: It computes simple moving averages (SMA) and exponential moving averages (EMA) for different periods.
• RSI Calculation: The script calculates a custom RSI for different periods.
• Signal Generation: It generates the institutional and short-term investor signals based on the calculated metrics.
4 — Plotting
The script plots the three main signals on the chart using the plot function.
The flow of data and logic is as follows:
• The reference_value function is used to find reference values for calculations.
• The calculate_institutional_and_short_term_signals function performs the core calculations and returns the institutional and short-term investor signals.
• The main script calls this function and plots the results.
█ CUSTOM FUNCTIONS
1 — reference_value(values, length)
• Purpose : Retrieves the first non-NA value from a specified number of past values.
• Parameters :
• values: An array of values.
• length: The number of past values to consider.
• Return Value : The first non-NA value found or na if no valid value is found.
• Functionality : Iterates through the specified number of past values and returns the first non-NA value.
2 — calculate_institutional_and_short_term_signals(low, close, open, volume)
• Purpose : Calculates the institutional and short-term investor signals based on price, volume, and moving average data.
• Parameters :
• low: Low price series.
• close: Close price series.
• open: Open price series.
• volume: Volume series.
• Return Values :
• institutional_signal: The institutional signal.
• institutional_build: The institutional build signal.
• short_term_investor_signal: The short-term investor signal.
• Functionality :
• Computes various price and volume metrics.
• Calculates moving averages and volume-weighted prices.
• Generates the institutional and short-term investor signals based on these metrics.
█ KEY POINTS AND TECHNIQUES
1 — Advanced Pine Script Features
• Custom Functions: The script defines and uses custom functions to encapsulate complex logic.
• Conditional Statements: Extensive use of iff and if statements to control the flow of calculations.
• Looping Constructs: The for loop in reference_value function to iterate through past values.
• Exponential Moving Averages (EMA): Used to smooth out price and signal changes.
• Volume-Weighted Price (VWP): Calculated to factor in volume in price analysis.
• Custom RSI Calculation: A custom RSI formula is used, which differs from the standard RSI calculation.
2 — Optimization Techniques
• Efficient Data Handling: The reference_value function efficiently finds the first non-NA value without unnecessary computations.
• Smoothed Signals: Using EMAs to smooth out noisy signals for better trend identification.
3 — Unique Approaches
• Combination of Metrics: The script combines multiple metrics (price, volume, moving averages, and custom RSI) to generate comprehensive signals.
• Institutional Build Signal: A unique approach to detect institutional activity by comparing current price levels with historical lows and smoothed price changes.
█ EXTENDED KNOWLEDGE AND APPLICATIONS
1 — Potential Modifications
• Input Parameters: Add input parameters to allow users to customize the lengths and thresholds used in the calculations.
• Strategy Version: Convert the indicator into a strategy by adding buy/sell signals based on the generated signals.
• Additional Indicators: Integrate other technical indicators (e.g., MACD, Bollinger Bands) to enhance the signal generation process.
2 — Similar Trading Scenarios
• Institutional Activity Analysis: Use similar techniques to analyze institutional activity in other markets or assets.
• Volume Analysis: Apply the volume-weighted price and volume analysis to identify significant price movements.
• Multi-Timeframe Analysis: Extend the script to analyze signals across multiple timeframes for a more robust trading strategy.
3 — Related Pine Script Concepts
• Pine Script Functions: Understanding how to define and use custom functions effectively.
• Conditional Logic: Mastering the use of iff and if statements for complex logic.
• Looping Constructs: Familiarity with for loops for iterating through data.
• Moving Averages: Knowledge of different types of moving averages and their applications.
• Volume Analysis: Techniques for incorporating volume data into price analysis.

WVAD (Optimized Log Scaled)The WVAD (Optimized Log Scaled) indicator is a refined version of the classic Williams' Volume Accumulation/Distribution (WVAD). This version introduces logarithmic scaling for better visualization and usability, especially when dealing with large value ranges. It also includes EMA smoothing to highlight trends and reduce noise, providing traders with a more precise and clear representation of market dynamics.
Key Features:
1.Logarithmic Scaling:
Applies a log-based transformation to the WVAD values, ensuring extreme values are compressed while maintaining the overall structure of the data.
The log scaling allows better readability and interpretation, particularly for volatile or high-volume markets.
2.EMA Smoothing:
Uses an exponential moving average (EMA) to smooth the logarithmic WVAD values.
Helps reduce noise while preserving short-term trends, making it suitable for both trend-following and reversal strategies.
3.Customizable Parameters:
N (Lookback Period): Defines the accumulation period for calculating WVAD.
EMA Smoothing Period: Controls the sensitivity of the EMA applied to the logarithmic WVAD.
Decimal Places: Adjusts the precision of the displayed values for clearer visualization.
Line Colors: Fully customizable colors for both the raw WVAD line and the smoothed EMA.
4.Directional Preservation:
Keeps the positive and negative signs of WVAD to reflect accumulation (buying pressure) or distribution (selling pressure) in the market.
5.Zero Line Reference:
A horizontal zero line is plotted to help traders easily identify bullish (above 0) or bearish (below 0) market conditions.
How to Use:
Identify Trends: The smoothed WVAD line (EMA) can help detect trends or shifts in buying/selling pressure.
Crossovers: Use crossovers of the WVAD with the zero line as potential buy or sell signals.
Divergence: Spot divergences between price and the WVAD for early indications of reversals.
Applications:
Suitable for intraday, swing, or longer-term trading strategies.
Works across various asset classes, including stocks, commodities, and cryptocurrencies.

Delta OscillatorAn advanced technical indicator that helps traders identify buying and selling pressure in the market by analyzing volume-based price movements.
Features
Real-time calculation of buying and selling volume
Cumulative delta conversion into oscillator format (-50 to +50 range)
Color-coded visualization (green for buying pressure, red for selling pressure)
Customizable period length for calculations
How It Works
The indicator:
Calculates buying/selling volume based on price direction
Accumulates delta over time
Normalizes values into oscillator format
Displays results as a colored line chart
Trading Applications
Identify potential trend reversals
Measure buying/selling momentum
Confirm price action signals
Spot divergences with price
Installation
Copy the provided Pine Script code
Open TradingView Chart → Pine Editor
Paste the code and click "Add to Chart"
Settings
Period: Adjustable timeframe for calculations (default: 14)
Visualization: Line width and colors can be customized

Enhanced Chaikin Money FlowEnhanced Chaikin Money Flow (CMF) with Normalized Distribution
The Enhanced Chaikin Money Flow (CMF) is a sophisticated version of Marc Chaikin's classic volume-weighted indicator that measures buying and selling pressure. This version incorporates statistical normalization and advanced smoothing techniques to provide more reliable signals.
Key Features
Normalized distribution (z-score) for better historical comparison
Multiple smoothing options (SMA, EMA, WMA, RMA) for noise reduction
Standard deviation bands (1σ and 2σ) to identify extreme readings
Adjustable parameters for customization
Alert system for extreme readings
Interpretation
Values represent standard deviations from the mean
Above 0: Indicates net buying pressure
Below 0: Indicates net selling pressure
Outside ±2σ bands: Suggests extreme market conditions
Crossovers of standard deviation bands may signal potential reversals
Technical Details
The indicator combines volume with price location within a bar to determine buying/selling pressure, then normalizes these values using a rolling z-score calculation. This normalization allows for better historical comparison and more reliable overbought/oversold signals.
Best used in conjunction with price action and other indicators for confirmation of potential market turns or trend strength.

ARMORE Capital: Support–Resistance Levels v2.0 [Enhanced]Enhanced S/R Levels with Signals
The "Enhanced S R Levels with Signals" indicator is designed to help traders and investors identify key Support and Resistance levels on a price chart. It also includes LONG and SHORT signals to help you see potential buy and sell opportunities. Here's a beginner-friendly breakdown of how it works and how to use it:
How it Works
Support and Resistance Levels:
Support Levels (blue lines) are prices where the stock tends to find a "floor" or buying interest, potentially pushing the price up. These levels are calculated based on the lowest prices over a period, with the sensitivity setting helping adjust the distance between each support level.
Resistance Levels (red lines) are prices where the stock often encounters a "ceiling" or selling interest, which could push the price down. These levels are calculated based on the highest prices over a period, with sensitivity adjusting the distance between each resistance level.
The indicator plots up to five support and five resistance lines, giving you a layered view of price levels where the market may react.
LONG and SHORT Signals:
LONG Signal (green arrow pointing up): When the closing price goes above the closest support level, the indicator shows a LONG signal below the bar, suggesting a potential upward trend.
SHORT Signal (red arrow pointing down): When the closing price goes below the closest resistance level, the indicator shows a SHORT signal above the bar, indicating a potential downward trend.
Background Ribbons:
When a LONG condition is met, a faint green background appears on the chart as a visual cue.
When a SHORT condition is met, a faint red background appears to signal potential bearish pressure.
How to Use It
1. Finding Entry and Exit Points: Use the LONG and SHORT signals as a guide, but remember to consider other factors before making trading decisions. A LONG signal suggests that price may rise, while a SHORT signal indicates potential downside.
2. Support & Resistance Levels: Treat these levels as potential points of interest. Prices often react at support or resistance, so you can look for confirmation (e.g., reversal patterns, volume spikes) around these levels.
3. Experiment with Sensitivity: Adjust the "Sensitivity" setting to see how it changes the spacing of support and resistance levels. Higher sensitivity may show more frequent support/resistance levels, which can be helpful for short-term traders.
DISCLAIMER : This is purely experimental and shouldn't be considered a blatant Buy-Sell Indicator. Please feel free to use it to supplement your research, share it with your friends, iterate and improve upon it, and use it to build better, more powerful tools!
Remember, always combine technical indicators with other analysis methods and manage your risk responsibly. Happy Trading!

Memecoin TrackerMemecoin Z-Score Tracker with Buy/Sell Table - Technical Explanation
How it Works:
This indicator calculates the Z-scores of various memecoins based on their price movements, using historical funding rates across multiple exchanges. A Z-score measures the deviation of the current price from its moving average, expressed in standard deviations. This provides insight into whether a coin is overbought (positive Z-score) or oversold (negative Z-score) relative to its recent history.
Key Components:
- Z-Score Calculation
- The lookback period is dynamically adjusted based on the chart’s timeframe to ensure consistency across different time intervals:
- For lower timeframes (e.g., minutes), the base lookback period is scaled to match approximately 240 minutes.
- For daily and higher timeframes, the base lookback period is fixed (e.g., 14 bars).
Memecoin Selection:
The indicator tracks several popular memecoins, including DOGE, SHIB, PEPE, FLOKI, and others.
Funding rates are fetched from exchanges like Binance, Bybit, and MEXC using the request.security() function, ensuring accurate real-time price data.
Thresholds for Buy/Sell Signals:
Users can set custom Z-score thresholds for buy (oversold) and sell (overbought) signals:
Default upper threshold: 2.5 (indicates overbought condition).
Default lower threshold: -2.5 (indicates oversold condition).
When a memecoin’s Z-score crosses above or below these thresholds, it signals potential buy or sell conditions.
Buy/Sell Table:
A table with two columns (BUY and SELL) is dynamically populated with memecoins that are currently oversold (buy signal) or overbought (sell signal).
Each column can hold up to 20 entries, providing a clear overview of current market opportunities.
Visual Feedback:
The Z-scores of each memecoin are plotted as a line on the chart, with color-coded feedback:
Red for overbought (Z-score > upper threshold),
Green for oversold (Z-score < lower threshold),
Other colors indicate neutral conditions.
Horizontal lines representing the upper and lower thresholds are plotted for reference.
How to Use It:
Adjust Thresholds:
You can modify the upper and lower Z-score thresholds in the settings to customize sensitivity. Lower thresholds will increase the likelihood of triggering buy/sell signals for smaller price deviations, while higher thresholds will focus on more extreme conditions.
View Real-Time Signals:
The table shows which memecoins are currently oversold (buy column) or overbought (sell column), updating dynamically as price data changes. Traders can monitor this table to identify trading opportunities quickly.
Use with Different Timeframes:
The Z-score lookback period adjusts automatically based on the chart's timeframe, making this indicator suitable for intraday and long-term traders.
Use shorter timeframes (e.g., 1-minute, 5-minute charts) for faster signals, while longer timeframes (e.g., daily, weekly) may yield more stable, trend-based signals.
Who It Is For:
Short-Term Traders: Those looking to capitalize on short-term price imbalances (e.g., day traders, scalpers) can use this indicator to identify quick buy/sell opportunities as memecoins oscillate around their moving averages.
Swing Traders: Swing traders can use the Z-score tracker to identify overbought or oversold conditions across multiple memecoins and ride the reversals back toward equilibrium.
Crypto Enthusiasts and Memecoin Investors: Anyone involved in the volatile memecoin market can use this tool to better time entries and exits based on market extremes.
This indicator is for traders seeking quantitative analysis of price extremes in memecoins. By tracking the Z-scores across multiple coins and dynamically updating buy/sell opportunities in a table, it provides a systematic approach to identifying trade setups.

PRINT_TYPELibrary "PRINT_TYPE"
Inputs
Inputs objects
Fields:
inbalance_percent (series int) : percentage coefficient to determine the Imbalance of price levels
stacked_input (series int) : minimum number of consecutive Imbalance levels required to draw extended lines
show_summary_footprint (series bool)
procent_volume_area (series int) : definition size Value area
new_imbalance_cond (series bool) : bool input for setup alert on new imbalance buy and sell
new_imbalance_line_cond (series bool) : bool input for setup alert on new imbalance line buy and sell
stop_past_imbalance_line_cond (series bool) : bool input for setup alert on stop past imbalance line buy and sell
Constants
Constants all Constants objects
Fields:
imbalance_high_char (series string) : char for printing buy imbalance
imbalance_low_char (series string) : char for printing sell imbalance
color_title_sell (series color) : color for footprint sell
color_title_buy (series color) : color for footprint buy
color_line_sell (series color) : color for sell line
color_line_buy (series color) : color for buy line
color_title_none (series color) : color None
Calculation_data
Calculation_data data for calculating
Fields:
detail_open (array) : array open from calculation timeframe
detail_high (array) : array high from calculation timeframe
detail_low (array) : array low from calculation timeframe
detail_close (array) : array close from calculation timeframe
detail_vol (array) : array volume from calculation timeframe
previos_detail_close (array) : array close from calculation timeframe
isBuyVolume (series bool) : attribute previosly bar buy or sell
Footprint_row
Footprint_row objects one footprint row
Fields:
price (series float) : row price
buy_vol (series float) : buy volume
sell_vol (series float) : sell volume
imbalance_buy (series bool) : attribute buy inbalance
imbalance_sell (series bool) : attribute sell imbalance
buy_vol_box (series box) : for ptinting buy volume
sell_vol_box (series box) : for printing sell volume
buy_vp_box (series box) : for ptinting volume profile buy
sell_vp_box (series box) : for ptinting volume profile sell
row_line (series label) : for ptinting row price
empty (series bool) : = true attribute row with zero volume buy and zero volume sell
Imbalance_line_var_object
Imbalance_line_var_object var objects printing and calculation imbalance line
Fields:
cum_buy_line (array) : line array for saving all history buy imbalance line
cum_sell_line (array) : line array for saving all history sell imbalance line
Imbalance_line
Imbalance_line objects printing and calculation imbalance line
Fields:
buy_price_line (array) : float array for saving buy imbalance price level
sell_price_line (array) : float array for saving sell imbalance price level
var_imba_line (Imbalance_line_var_object) : var objects this type
Footprint_bar
Footprint_bar all objects one bar with footprint
Fields:
foot_rows (array) : objects one row footprint
imba_line (Imbalance_line) : objects imbalance line
row_size (series float) : size rows
total_vol (series float) : total volume one footprint bar
foot_buy_vol (series float) : buy volume one footprint bar
foot_sell_vol (series float) : sell volume one footprint bar
foot_max_price_vol (map) : map with one value - price row with max volume buy + sell
calc_data (Calculation_data) : objects with detail data from calculation resolution
Support_objects
Support_objects support object for footprint calculation
Fields:
consts (Constants) : all consts objects
inp (Inputs) : all input objects
bar_index_show_condition (series bool) : calculation bool value for show all objects footprint
row_line_color (series color) : calculation value - color for row price
dop_info (series string)
show_table_cond (series bool)
Charan_Trading_IndicatorCharan_Trading_Indicator Overview:
The Charan_Trading_Indicator combines several technical analysis tools, including Bollinger Bands, RSI (Relative Strength Index), VWAP (Volume-Weighted Average Price), and ATR (Average True Range), to provide buy and sell signals. The script incorporates multiple strategies, such as crack snap setups, overbought/oversold levels, and trend continuation indicators, all tailored for precise market entry and exit points.
Key Components:
RSI (Relative Strength Index):
The indicator uses RSI to detect overbought (RSI > 70) and oversold (RSI < 30) market conditions.
Alerts are triggered when prices are within the specified buy/sell range and RSI crosses these thresholds.
Bollinger Bands:
Bollinger Bands are calculated based on a configurable moving average and standard deviation.
The script identifies potential buy signals when the price dips below the lower Bollinger Band and recovers, and sell signals when the price exceeds the upper Bollinger Band and retraces.
Crack Snap Strategies:
The indicator incorporates multiple variations of the crack snap strategy:
Buy Signals: Triggered when price opens below the lower Bollinger Band and closes above it, alongside certain conditions in previous candles.
Sell Signals: Triggered when price opens above the upper Bollinger Band and closes below it, with similar candle patterns.
Variations such as 3-candle (3C) and 4-candle (4C) versions refine the crack snap setups for more robust signals.
Isolated Candle Conditions:
The indicator tracks isolated candles, where the entire candle lies above or below the Bollinger Bands, to identify potential reversal points.
Trend Continuation Signals:
Conditions based on the candle range and previous highs/lows allow the indicator to generate signals for trend continuation:
Buy signals when price breaks above the previous two highs.
Sell signals when price breaks below the previous two lows.
VWAP (Volume-Weighted Average Price):
The indicator integrates VWAP to give additional support and resistance levels, ensuring signals align with volume trends.
ATR-Based Stop Loss:
For both buy and sell conditions, the script plots stop-loss levels based on the ATR (Average True Range), giving dynamic risk management levels.
Buy/Sell Ranges:
The user can set minimum and maximum price ranges for buy and sell signals, ensuring that the indicator only generates alerts within desired price ranges.
How It Works:
Buy Signals: The script generates buy signals based on multiple conditions, including the crack snap strategy, oversold RSI levels, and trend continuation setups. When these conditions are met, green triangles appear below the price bars, and an alert is triggered.
Sell Signals: Sell signals are triggered when the opposite conditions are met (overbought RSI, crack snap sell setups, trend breaks), and red triangles appear above the price bars.
Visual Indicators: The script plots upper and lower Bollinger Bands, stop loss levels, and VWAP on the chart, providing a comprehensive view of market conditions and support/resistance levels.
This indicator is versatile, combining multiple technical tools for robust decision-making in trading. It generates alerts, plots visual markers, and integrates risk management, making it a well-rounded tool for technical analysis.
This indicator is versatile, combining multiple technical tools for robust decision-making in trading. It generates alerts, plots visual markers, and integrates risk management, making it a well-rounded tool for technical analysis.

Varanormal Mac N Cheez Strategy v1Mac N Cheez Strategy (Set a $200 Take profit Manually)
It's super cheesy. Strategy does the following:
Here's a detailed explanation of what the entire script does, including its key components, functionality, and purpose.
1. Strategy Setup and Input Parameters:
Strategy Name: The script is named "NQ Futures $200/day Strategy" and is set as an overlay, meaning all elements (like moving averages and signals) are plotted on the price chart.
Input Parameters:
fastLength: This sets the length of the fast moving average. The user can adjust this value, and it defaults to 9.
slowLength: This sets the length of the slow moving average. The user can adjust this value, and it defaults to 21.
dailyTarget: The daily profit target, which defaults to $200. If set to 0, this disables the daily profit target.
stopLossAmount: The fixed stop-loss amount per trade, defaulting to $100. This value is used to calculate how much you're willing to lose on a single trade.
trailOffset: This value sets the distance for a trailing stop. It helps protect profits by automatically adjusting the stop-loss as the price moves in your favor.
2. Calculating the Moving Averages:
fastMA: The fast moving average is calculated using the ta.sma() function on the close price with a period length of fastLength. The ta.sma() function calculates the simple moving average.
slowMA: The slow moving average is also calculated using ta.sma() but with the slowLength period.
These moving averages are used to determine trend direction and identify entry points.
3. Buy and Sell Signal Conditions:
longCondition: This is the buy condition. It occurs when the fast moving average crosses above the slow moving average. The script uses ta.crossover() to detect this crossover event.
shortCondition: This is the sell condition. It occurs when the fast moving average crosses below the slow moving average. The script uses ta.crossunder() to detect this crossunder event.
4. Executing Buy and Sell Orders:
Buy Orders: When the longCondition is true (i.e., fast MA crosses above slow MA), the script enters a long position using strategy.entry("Buy", strategy.long).
Sell Orders: When the shortCondition is true (i.e., fast MA crosses below slow MA), the script enters a short position using strategy.entry("Sell", strategy.short).
5. Setting Stop Loss and Trailing Stop:
Stop-Loss for Long Positions: The stop-loss is calculated as the entry price minus the stopLossAmount. If the price falls below this level, the trade is exited automatically.
Stop-Loss for Short Positions: The stop-loss is calculated as the entry price plus the stopLossAmount. If the price rises above this level, the short trade is exited.
Trailing Stop: The trail_offset dynamically adjusts the stop-loss as the price moves in favor of the trade, locking in profits while still allowing room for market fluctuations.
6. Conditional Daily Profit Target:
The script includes a daily profit target that automatically closes all trades once the total profit for the day reaches or exceeds the dailyTarget.
Conditional Logic:
If the dailyTarget is greater than 0, the strategy checks whether the strategy.netprofit (total profit for the day) has reached or exceeded the target.
If the strategy.netprofit >= dailyTarget, the script calls strategy.close_all(), closing all open trades for the day and stopping further trading.
If dailyTarget is set to 0, this logic is skipped, and the script continues trading without a daily profit target.
7. Plotting Moving Averages:
plot(fastMA): This plots the fast moving average as a blue line on the price chart.
plot(slowMA): This plots the slow moving average as a red line on the price chart. These help visualize the crossover points and the trend direction on the chart.
8. Plotting Buy and Sell Signals:
plotshape(): The script uses plotshape() to add visual markers when buy or sell conditions are met:
"Long Signal": When a buy condition (longCondition) is met, a green marker is plotted below the price bar with the label "Long".
"Short Signal": When a sell condition (shortCondition) is met, a red marker is plotted above the price bar with the label "Short".
These markers help traders quickly see when buy or sell signals occurred on the chart.
In addition, triangle markers are plotted:
Green Triangle: Indicates where a buy entry occurred.
Red Triangle: Indicates where a sell entry occurred.
Summary of What the Script Does:
Inputs: The script allows the user to adjust moving average lengths, daily profit targets, stop-loss amounts, and trailing stop offsets.
Signals: It generates buy and sell signals based on the crossovers of the fast and slow moving averages.
Order Execution: It executes long positions on buy signals and short positions on sell signals.
Stop-Loss and Trailing Stop: It sets dynamic stop-losses and uses a trailing stop to protect profits.
Daily Profit Target: The strategy stops trading for the day once the net profit reaches the daily target (unless the target is disabled by setting it to 0).
Visual Markers: It plots moving averages and buy/sell signals directly on the main price chart to aid in visual analysis.
This script is designed to trade based on moving average crossovers, with robust risk management features like stop-loss and trailing stops, along with an optional daily profit target to limit daily trading activity. Let me know if you need further clarification or want to adjust any specific part of the script!

Anomaly Detection with Standard Deviation [CHE]Anomaly Detection with Standard Deviation in Trading
Application for Traders
Traders can use this indicator to identify potential turning points in the market. Anomalies above the upper threshold may indicate overbought conditions, suggesting a possible reversal or sell opportunity. Conversely, anomalies below the lower threshold might signal oversold conditions, presenting a potential buying opportunity. By combining these signals with other technical analysis tools, traders can make more informed decisions and refine their trading strategies.
Introduction
Welcome to this presentation on Anomaly Detection using Standard Deviation in the context of trading. This method helps traders identify unusual price movements that may indicate potential trading opportunities. We will walk through the concept, explain how to set up the indicator, and discuss how traders can utilize it effectively.
Concept Overview
Anomaly Detection using Standard Deviation is a statistical method that identifies price points in a financial market that deviate significantly from the norm. The method relies on calculating the moving average and the standard deviation of a chosen price indicator over a specified period. By defining thresholds (e.g., 3 standard deviations above and below the mean), the method flags these deviations as anomalies, which can signal potential trading opportunities.
1. Selecting the Data Source
Description: The first step in setting up the indicator is choosing the price data that will be analyzed. Common options include the closing price, opening price, highest price, lowest price, or a combination of these (such as the average of the open, high, low, and close prices, known as OHLC4).
Importance: The choice of data source affects the sensitivity and relevance of the detected anomalies.
2. Setting the Calculation Period
Description: The calculation period refers to the number of time units (such as days, hours, or minutes) used to compute the moving average and standard deviation. A typical default period might be 20 units.
Importance: A shorter period makes the indicator more responsive to recent changes, while a longer period smooths out short-term fluctuations and highlights more significant trends.
3. Determining the Number of Displayed Lines and Labels
Description: Traders can configure how many anomaly lines and labels are displayed on the chart at any given time. This is crucial for maintaining a clear and readable chart, especially in volatile markets.
Importance: Limiting the number of displayed anomalies helps avoid clutter and focuses attention on the most recent or relevant data points.
4. Calculating the Mean and Standard Deviation
Description: The mean (or moving average) represents the central tendency of the price data, while the standard deviation measures the dispersion or volatility around this mean.
Importance: These statistical measures are fundamental to determining the thresholds for what constitutes an "anomaly."
5. Defining Anomaly Thresholds
Description: Anomaly thresholds are typically set at 3 standard deviations above and below the mean. Prices that exceed these thresholds are considered anomalies, signaling potential overbought (above the upper threshold) or oversold (below the lower threshold) conditions.
Importance: These thresholds help traders identify extreme market conditions that might present trading opportunities.
6. Identifying Anomalies
Description: The indicator checks whether the high or low prices exceed the defined thresholds. If they do, these price points are flagged as anomalies.
Importance: Identifying these points can alert traders to unusual market behavior, prompting them to consider buying, selling, or holding their positions.
7. Visualizing the Anomalies
Description: The indicator plots the thresholds on the chart as lines, with anomalies highlighted through additional visual cues, such as labels or lines.
Importance: This visualization makes it easy for traders to spot significant deviations from the norm, which might warrant further analysis or immediate action.
8. Managing Displayed Anomalies
Description: To keep the chart organized, the indicator automatically removes the oldest lines and labels when the number exceeds the user-defined limit.
Importance: This feature ensures that the chart remains clear and focused on the most relevant data points, preventing information overload.
Conclusion
The Anomaly Detection with Standard Deviation indicator is a powerful tool for identifying significant deviations in market behavior. By customizing parameters such as the calculation period and the number of displayed anomalies, traders can tailor the indicator to suit their specific needs, leading to more effective trading decisions.
Best regards
Chervolino

Volatility Adaptive Signal Tracker (VAST)The Adaptive Trend Following Buy/Sell Signals Pine Script is designed to help traders identify and capitalize on market trends using an adaptive trend-following strategy. This script focuses on generating reliable buy and sell signals by analyzing market trends and volatility. It simplifies the trading process by providing clear signals without plotting additional lines, making it easy to use and interpret.
Key Features:
Adaptive Trend Following:
The script employs an adaptive trend-following approach that leverages market volatility to generate buy and sell signals. This method is effective in both trending and volatile markets.
Inputs and Customization:
The script includes customizable parameters for the Simple Moving Average (SMA) length, the Average True Range (ATR) length, and the ATR multiplier. These inputs allow traders to adjust the sensitivity of the signals to match their trading style and market conditions.
Signal Generation:
Buy Signal: Generated when the closing price crosses above the upper adaptive band, indicating a potential upward trend.
Sell Signal: Generated when the closing price crosses below the lower adaptive band, indicating a potential downward trend.
Visual Signals:
The script uses plotshape to mark buy signals with green labels below the bars and sell signals with red labels above the bars. This clear visual representation helps traders quickly identify trading opportunities.
Alert Conditions:
The script sets up alert conditions for both buy and sell signals. Traders can use these alerts to receive notifications when a signal is generated, ensuring they do not miss any trading opportunities.
How It Works:
SMA Calculation: The script calculates the Simple Moving Average (SMA) over a specified period, which helps in identifying the general trend direction.
ATR Calculation: The Average True Range (ATR) is calculated to measure market volatility.
Adaptive Bands: Upper and lower adaptive bands are created by adding and subtracting a multiple of the ATR to the SMA, respectively.
Signal Logic: Buy signals are generated when the closing price crosses above the upper band, while sell signals are generated when the closing price crosses below the lower band.
Example Use Case:
A trader looking to capitalize on medium-term trends in the Nifty futures market can use this script to receive timely buy and sell signals. By customizing the SMA length and ATR parameters, the trader can fine-tune the script to match their trading strategy, ensuring they enter and exit trades at optimal points.
Benefits:
Simplicity: The script provides clear buy and sell signals without cluttering the chart with additional lines or indicators.
Adaptability: Customizable parameters allow traders to adapt the script to various market conditions and trading styles.
Alerts: Built-in alert conditions ensure traders receive timely notifications, helping them to act quickly on trading signals.
How to Use:
Open TradingView: Go to the TradingView website and log in.
Create a New Chart: Click on the “Chart” button to open a new chart.
Open the Pine Script Editor: Click on the “Pine Editor” tab at the bottom of the chart.
Create a New Script: Delete any default code in the Pine Script editor and paste the provided script.
Add to Chart: Click on the “Add to Chart” button to compile and add the script to your chart.
Save the Script: Click “Save” and name the script.
Set Alerts: Right-click on the chart, select “Add Alert,” and choose the appropriate condition to set alerts for buy and sell signals.

S&P Short-Range Oscillator**SHOULD BE USED ON THE S&P 500 ONLY**
The S&P Short-Range Oscillator (SRO), inspired by the principles of Jim Cramer's oscillator, is a technical analysis tool designed to help traders identify potential buy and sell signals in the stock market, specifically for the S&P 500 index. The SRO combines several market indicators to provide a normalized measure of market sentiment, assisting traders in making informed decisions.
The SRO utilizes two simple moving averages (SMAs) of different lengths: a 5-day SMA and a 10-day SMA. It also incorporates the daily price change and market breadth (the net change of closing prices). The 5-day and 10-day SMAs are calculated based on the closing prices. The daily price change is determined by subtracting the opening price from the closing price. Market breadth is calculated as the difference between the current closing price and the previous closing price.
The raw value of the oscillator, referred to as SRO Raw, is the sum of the daily price change, the 5-day SMA, the 10-day SMA, and the market breadth. This raw value is then normalized using its mean and standard deviation over a 20-day period, ensuring that the oscillator is centered and maintains a consistent scale. Finally, the normalized value is scaled to fit within the range of -15 to 15.
When interpreting the SRO, a value below -5 indicates that the market is potentially oversold, suggesting it might be a good time to start buying stocks as the market could be poised for a rebound. Conversely, a value above 5 suggests that the market is potentially overbought. In this situation, it may be prudent to hold on to existing positions or consider selling if you have substantial gains.
The SRO is visually represented as a blue line on a chart, making it easy to track its movements. Red and green horizontal lines mark the overbought (5) and oversold (-5) levels, respectively. Additionally, the background color changes to light red when the oscillator is overbought and light green when it is oversold, providing a clear visual cue.
By incorporating the S&P Short-Range Oscillator into your trading strategy, you can gain valuable insights into market conditions and make more informed decisions about when to buy, sell, or hold your stocks. However, always consider other market factors and perform your own analysis before making any trading decisions.
The S&P Short-Range Oscillator is a powerful tool for traders looking to gain insights into market sentiment. It provides clear buy and sell signals through its combination of multiple indicators and normalization process. However, traders should be aware of its lagging nature and potential complexity, and use it in conjunction with other analysis methods for the best results.
Disclaimer
The S&P Short-Range Oscillator is for informational purposes only and should not be considered financial advice. Trading involves risk, and you should conduct your own research or consult a financial advisor before making investment decisions. The author is not responsible for any losses incurred from using this indicator. Use at your own risk.

Jobinsabu014This Pine Script code is for an advanced trading indicator that displays enhanced moving averages with buy and sell labels, trend probability, and support/resistance levels. Here’s a detailed description of its components and functionality:
### Description:
1. **Indicator Initialization**:
- The indicator is named "Enhanced Moving Averages with Buy/Sell Labels and Trend Probability" and is set to overlay on the chart.
2. **Input Parameters**:
- **Moving Averages**: Four different moving averages (short and long periods for default and enhanced) with customizable periods.
- **Probability Threshold**: Determines the threshold for trend probability.
- **Support/Resistance Lookback**: Number of bars to look back for calculating support and resistance levels.
- **Signals Valid From**: Timestamp from which the signals are considered valid.
3. **Moving Averages Calculation**:
- **Default Moving Averages**: Calculated using simple moving averages (SMA) for the specified periods.
- **Enhanced Moving Averages**: Calculated using SMAs for different specified periods.
4. **Plotting Moving Averages**:
- Plots the default and enhanced moving averages with different colors for distinction.
5. **Crossover Detection**:
- Detects when the short moving average crosses above or below the long moving average for default moving averages.
6. **Buy/Sell Signal Labels**:
- Adds "BUY" and "SELL" labels on the chart when crossovers are detected after the specified valid timestamp.
- Tracks entry prices for buy/sell signals and adds labels when the price moves +100 points.
7. **Trend Detection for Enhanced Indicator**:
- Detects uptrend or downtrend based on the enhanced moving averages.
- Calculates a simple probability of trend based on price movement and EMA.
- Determines buy and sell signals based on trend conditions and volume-based buy/sell pressure.
8. **Plot Buy/Sell Signals for Enhanced Indicator**:
- Plots buy/sell signals based on the enhanced conditions.
9. **Background Color for Trends**:
- Changes the background color to green for uptrend and red for downtrend.
10. **Trend Lines**:
- Draws imaginary trend lines for uptrend and downtrend based on enhanced moving averages.
11. **Support and Resistance Levels**:
- Calculates and plots support and resistance levels using the specified lookback period.
- Stores and plots previous support and resistance levels with dashed lines.
12. **Expected Trend Labels**:
- Adds labels indicating expected uptrend or downtrend based on buy/sell signals.
13. **Alerts**:
- Sets alert conditions for buy and sell signals, triggering alerts when these conditions are met.
14. **Demand and Supply Zones**:
- Draws and extends horizontal lines for demand (support) and supply (resistance) zones.
### Summary:
This script enhances traditional moving average crossovers by adding trend probability calculations, volume-based pressure, and support/resistance levels. It visualizes expected trends and provides comprehensive buy/sell signals with corresponding labels, background color changes, and alerts to help traders make informed decisions.

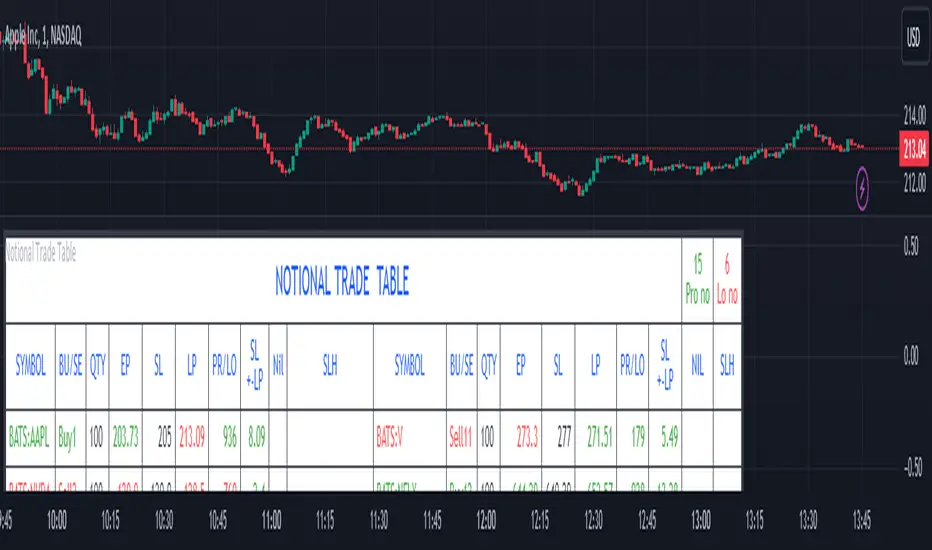
Notional Trade Table
Notional Trade Table indicator displays notional trade values for given Buy and Sell of given input of Symbol, Quantity, Entry Price and Stop Loss .
Sections of Input Menu Table are supported with Tool Tip icons.
Input Symbols:
(Refer Input Menu)
User can choose maximum 20 Symbols.
Input Side Choice (BUY/SELL):
(Refer Input Menu)
After choosing Symbol, User has to choose the BUY or SELL option for each Symbol against the corresponding Sybol number. If NIL is selected “Nil is selected ” message is displayed prompting the user to select BUY or SELL sides.
For example in the above Input Menu:
Sym1 is BATS:AAPL. Corresponding Side 1 is Sell1.
Sym2 is BATS:NVDA Corresponding Side 2 Sell 2.
Sym12 is BATS:NFLX. Corresponding Side 12 is Buy12 and so on.
Input Quantity:
(Refer Input Menu)
Next enter Corresponding Quantity of BUY or SELL in relevant Quantity Input Box. Quantity cannot be Zero. Defval is 1.
For Sym1 input in Qty 1 box,for Sym2 input in Qty 2 box and so on.
Input Entry Price:
(Refer Input Menu)
After entering Quantity Input Entry Price for Corresponding Symbol.
Input for Sym1 Entry Price in EP1 box
Input for Sym2 Entry Price in EP2 box
and so on.
Input Stop Loss:
(Refer Input Menu)
Next Enter corresponding Stop Loss for each Symbol.
SL1 input box denotes Sym1 Stop Loss.
SL2 input box denotes Sym2 Stop Loss.
SL3 input box denotes Sym3 Stop Loss and so on.
Stop Loss for Chosen BUY side should be below corresponding Entry Price/Last Price. Otherwise a message is displayed “SL Hit”. User has to enter valid data.
Stop Loss for Chosen SELL side should be above corresponding Entry Price/Last Price. Otherwise a message is displayed “SL Hit”. User has to enter valid data.
Notional Trade Table:
(Refer the Table on Chart)
From the input menu filled by User script captures the Symbol, BUY/SELL options, Quantity,
Entry Price and Stop Loss details under the corresponding heads in the Notional Trade Table.
The script captures the live Last traded Price under the head LP and calculates and displays corresponding Profit or Loss under PR/LO column in the table.
SL+- LP is the difference between Last traded Price (LP) and Stop Loss Price. Positive figure under this head reflects Stop Loss cushion available .
Nil header column reflects message “NIL selected” prompting the User to select BUY or SELL sides.
SLH header displays “SL Hit” on Stop Loss Hit or wrong input of Stop Loss inconsistent with BUY or SELL sides of Trade. On “SL Hit” message all values in corresponding Symbol becomes Zero. User has to re-enter the details fresh .
On the top left side corner of the table there are 2 cells with Prono and Lono.They denote the number of trades which are in Profit (Prono) and which are in Loss(Lono).
It is preferable to choose Symbols from a single country exchange commensurate with the Time zone. Otherwise if Exchange and Chart time Zone differs there is risk of data loss in the table.
DISCLAIMER: For educational and entertainment purpose only .Nothing in this content should be interpreted as financial advice or a recommendation to buy or sell any sort of security/ies or investment/s.
RSIBands with BBThis indicator combines three popular technical analysis tools:
RSI Bands: These bands are based on the Relative Strength Index (RSI) and visually represent overbought and oversold zones. The indicator plots upper and lower bands calculated using a user-defined RSI level and highlights potential buying and selling opportunities near these zones.
Bollinger Bands: These bands depict volatility with a moving average (basis line) and upper and lower bands at a user-defined standard deviation away from the basis line. Narrowing bands suggest potential breakouts, while widening bands indicate increased volatility.
Williams Fractals (with Confirmation): This custom function identifies potential reversal points based on price action patterns. The indicator highlights buy/sell signals when a confirmed fractal forms (previous fractal and price crossing a Bollinger Band).
Key Features:
User-defined parameters: You can adjust the RSI level, Bollinger Band standard deviation, and fractal period according to your trading strategy.
Visual confirmation: The indicator highlights confirmed buy/sell signals based on fractal patterns and price crossing Bollinger Bands.
Flexibility: This indicator provides a combination of trend, volatility, and reversal identification tools, allowing for a multi-faceted approach to technical analysis.
How to Use:
Add the indicator to your chart.
Adjust the RSI level, Bollinger Band standard deviation, and fractal period based on your preference.
Look for buy signals when a green background appears and there's a confirmed up fractal (upward triangle) with the price crossing above the upper Bollinger Band.
Look for sell signals when a red background appears and there's a confirmed down fractal (downward triangle) with the price crossing below the lower Bollinger Band.
Disclaimer:
This indicator is for informational purposes only and should not be considered financial advice. Always conduct your own research and due diligence before making any trading decisions.
footprint_typeLibrary "footprint_type"
Contains all types for calculating and rendering footprints
Inputs
Inputs objects
Fields:
inbalance_percent (series int) : percentage coefficient to determine the Imbalance of price levels
stacked_input (series int) : minimum number of consecutive Imbalance levels required to draw extended lines
show_summary_footprint (series bool) : bool input for show summary footprint
procent_volume_area (series int) : definition size Value area
show_vah (series bool) : bool input for show VAH
show_poc (series bool) : bool input for show POC
show_val (series bool) : bool input for show VAL
color_vah (series color) : color VAH line
color_poc (series color) : color POC line
color_val (series color) : color VAL line
show_volume_profile (series bool)
new_imbalance_cond (series bool) : bool input for setup alert on new imbalance buy and sell
new_imbalance_line_cond (series bool) : bool input for setup alert on new imbalance line buy and sell
stop_past_imbalance_line_cond (series bool) : bool input for setup alert on stop past imbalance line buy and sell
Constants
Constants all Constants objects
Fields:
imbalance_high_char (series string) : char for printing buy imbalance
imbalance_low_char (series string) : char for printing sell imbalance
color_title_sell (series color) : color for footprint sell
color_title_buy (series color) : color for footprint buy
color_line_sell (series color) : color for sell line
color_line_buy (series color) : color for buy line
color_title_none (series color) : color None
Calculation_data
Calculation_data data for calculating
Fields:
detail_open (array) : array open from calculation timeframe
detail_high (array) : array high from calculation timeframe
detail_low (array) : array low from calculation timeframe
detail_close (array) : array close from calculation timeframe
detail_vol (array) : array volume from calculation timeframe
previos_detail_close (array) : array close from calculation timeframe
isBuyVolume (series bool) : attribute previosly bar buy or sell
Footprint_row
Footprint_row objects one footprint row
Fields:
price (series float) : row price
buy_vol (series float) : buy volume
sell_vol (series float) : sell volume
imbalance_buy (series bool) : attribute buy inbalance
imbalance_sell (series bool) : attribute sell imbalance
buy_vol_box (series box) : for ptinting buy volume
sell_vol_box (series box) : for printing sell volume
buy_vp_box (series box) : for ptinting volume profile buy
sell_vp_box (series box) : for ptinting volume profile sell
row_line (series label) : for ptinting row price
empty (series bool) : = true attribute row with zero volume buy and zero volume sell
Value_area
Value_area objects for calculating and printing Value area
Fields:
vah_price (series float) : VAH price
poc_price (series float) : POC price
val_price (series float) : VAL price
vah_label (series label) : label for VAH
poc_label (series label) : label for POC
val_label (series label) : label for VAL
vah_line (series line) : line for VAH
poc_level (series line) : line for POC
val_line (series line) : line for VAL
Imbalance_line_var_object
Imbalance_line_var_object var objects printing and calculation imbalance line
Fields:
cum_buy_line (array) : line array for saving all history buy imbalance line
cum_sell_line (array) : line array for saving all history sell imbalance line
Imbalance_line
Imbalance_line objects printing and calculation imbalance line
Fields:
buy_price_line (array) : float array for saving buy imbalance price level
sell_price_line (array) : float array for saving sell imbalance price level
var_imba_line (Imbalance_line_var_object) : var objects this type
Footprint_info_var_object
Footprint_info_var_object var objects for info printing
Fields:
cum_delta (series float) : var delta volume
cum_total (series float) : var total volume
cum_buy_vol (series float) : var buy volume
cum_sell_vol (series float) : var sell volume
cum_info (series table) : table for ptinting
Footprint_info
Footprint_info objects for info printing
Fields:
var_info (Footprint_info_var_object) : var objects this type
total (series label) : total volume
delta (series label) : delta volume
summary_label (series label) : label for ptinting
Footprint_bar
Footprint_bar all objects one bar with footprint
Fields:
foot_rows (array) : objects one row footprint
val_area (Value_area) : objects Value area
imba_line (Imbalance_line) : objects imbalance line
info (Footprint_info) : objects info - table,label and their variable
row_size (series float) : size rows
total_vol (series float) : total volume one footprint bar
foot_buy_vol (series float) : buy volume one footprint bar
foot_sell_vol (series float) : sell volume one footprint bar
foot_max_price_vol (map) : map with one value - price row with max volume buy + sell
calc_data (Calculation_data) : objects with detail data from calculation resolution
Support_objects
Support_objects support object for footprint calculation
Fields:
consts (Constants) : all consts objects
inp (Inputs) : all input objects
bar_index_show_condition (series bool) : calculation bool value for show all objects footprint
row_line_color (series color) : calculation value - color for row price

Pivot Points + Day First Candle Breakout + VWAP + Supertrend This indicator amalgamates several key indicators to provide a comprehensive analysis for trading decisions, including SuperTrend, Pivot Points, VWAP, along with the Day First Candle Breakout strategy.
Key Features:
Day First Candle Breakout: Identifies potential breakout opportunities based on the first candle of the trading day. It utilizes the high and low of the initial trading range to determine entry points.
Timeframe Selection: Allows users to select the timeframe for analyzing the first candle (e.g., 5, 15, or 60 minutes).
Previous Day and Week High/Low: Displays the high and low of the previous day and week to provide additional context for trading decisions and assess the strength of the trend.
Trend Strength Analysis: Indicates whether the current price is above or below the previous day's high or low, signaling a stronger bullish or bearish trend respectively.
SuperTrend Indicator: Visualizes the trend direction and potential reversal points based on the SuperTrend indicator. It helps traders to stay aligned with the prevailing trend and avoid premature exits.
Pivot Points: Presents key support and resistance levels derived from Pivot Points, assisting traders in identifying potential reversal or breakout zones.
VWAP (Volume Weighted Average Price): Plots VWAP to provide insight into the average price traded over a given period, aiding in determining the fair value of the asset and potential buying/selling zones.
Trading Signals:
Buy Signal: Triggered when the price exceeds the high of the initial trading range after an upward price gap.
Sell Signal: Generated when the price falls below the low of the initial trading range after a downward price gap.
Caveats for Effective Trading:
Extended Trading Ranges: Adjusts support and resistance levels if the initial trading range extends beyond the defined timeframe.
Morning Noise Consideration: Exercises caution during volatile morning sessions to avoid false breakouts and whipsaws.
Pullbacks and Narrow Range Bars: Looks for opportunities during pullbacks or when the price forms narrow range bars to enter trades, reducing the risk of sudden reversals.

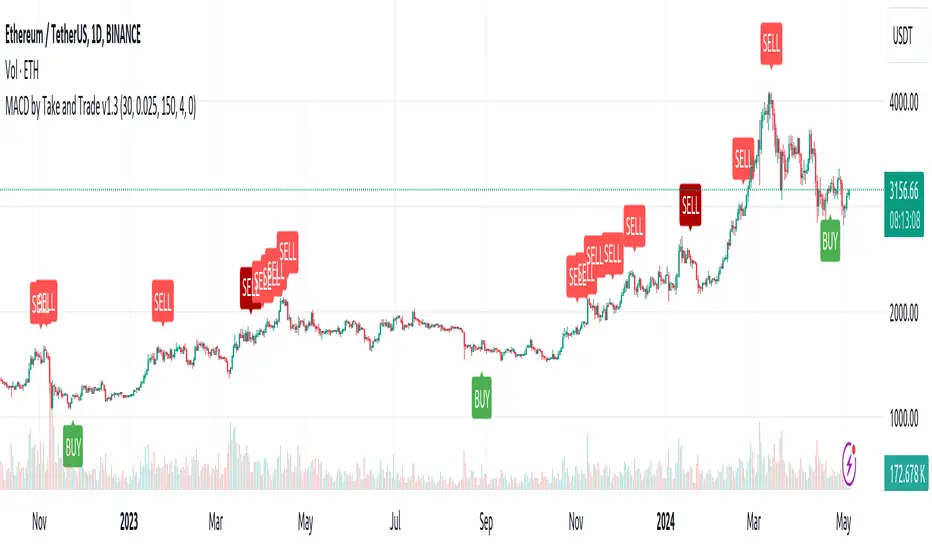
MACD by Take and TradeImproved version of MACD with asymmetrical BUY and SELL approaches.
This indicator is based on popular MACD one, but with some "tricks" designed to make it more applicable to the rapidly changing crypto market.
Key benefits:
Dynamic auto-adjusted threshold to filter out weak signals
Highlighted BUY/SELL signals with divergence (if a signal is accompanied by divergence, for example, price makes a new high while macd has a second high below the first, this signal is considered stronger and will be highlighted in a darker color)
Boost BUY signals on very slow market in accumulation phase
Not symmetric! It uses 2 different signal lines, which allows to obtain SELL signals earlier comparing to classic MACD approach
Classic concept of MACD
Classic MACD, in its simplest case, consists of two lines - macd line and signal line. Macd line is a difference between so-called "fast" and "slow" EMA lines (there are just a Exponential Moving Average lines with different windows: "12" for fast and "26" for slow). Signal line is just a smoothed "macd" line.
When macd line crosses signal line from bottom to up and intersection point < 0, this is "BUY" signal. And vise versa, when macd line crosses signal line from top to bottom, and intersection point > 0, this is "SELL" signal.
Parameters used in default configuration of classic MACD indicator:
Fast line: EMA-12
Slow line: EMA-26
Signal line: EMA-9
Problem of classic concept
Classic MACD indicator usually gives not bad "BUY" signals, especially if using them not for operational trading but for "investment" strategy. But "SELL" signalls usually generated too late. Simply because the market tends to fall much faster than it rises.
Possible solution (the main feature of our version of MACD)
To make indicator react faster on SELL condition, while still keeping it reliable for BUY signals, we decided to use two signal lines . Faster than default signal line (with window=6) for BUY signals and much faster than default (with window=2) for SELL signals.
This approach allowed us to receive sell signals earlier and exit deals on more favorable prices. Trade off of this change - is the number of SELL signals - there were more of them. However, this does not matter, since we receive the very first sell signal with a "very fast signal line" much earlier than with classic indicator settings.
Parameters we use in our improved MACD indicator:
Fast line: EMA-12
Slow line: EMA-24
Faster signal line: EMA-6
Much faster signal line: EMA-2
Removing noise (false triggerings)
Other drawback of classic MACD - it generates a lot of "weak" (false) signals. This signals are generated when macd crosses signal line much close to zero-line. And usually there are a lot of such intersections.
To remove this kind of noise, we added a trigger threshold, which by default is equal to 2.5% of the average asset price over a long period of time. Due to the link to the average price, this threshold automatically takes a specific value for each trading pair. Threshold 2.5% works perfect for all trading pairs for 1D timeframe. For other timeframes user can (and maybe will want) change it.
Boost weak BUY signals in a prolonged bear market
Signals on bearish stage are usually very weak, because there is no volatility, and no price impulse. And such signals will be filtered out as "noise" - see above. But this time is perfect time to buy! Therefore, we further boost the buy signals in a prolonged bear market so that they can pass through the filter and appear on the chart. Bearish period is the best time to invest!
Developed by Take and Trade. Enjoy using it!
KDJ / Connectable [Azullian]Enhance your analysis with our KDJ. Oscillate through buying and selling signals seamlessly, identifying potential reversals with accuracy.
This connectable KDJ indicator is part of an indicator system designed to help test, visualize and build strategy configurations without coding. Like all connectable indicators , it interacts through the TradingView input source, which serves as a signal connector to link indicators to each other. All connectable indicators send signal weight to the next node in the system until it reaches either a connectable signal monitor, signal filter and/or strategy.
█ UNIFORM SETTINGS AND A WAY OF WORK
Although connectable indicators may have specific weight scoring conditions, they all aim to follow a standardized general approach to weight scoring settings, as outlined below.
■ Connectable indicators - Settings
• 🗲 Energy: Energy applies an ATR multiplier to the plotted shapes on the chart. A higher value plots shapes farther away from the candle, enhancing visibility.
• ☼ Brightness: Brightness determines the opacity of the shape plotted on the chart, aiding visibility. Indicator weight also influences opacity.
• → Input: Use the input setting to specify a data source for the indicator. Here you can connect the indicator to other indicators.
• ⌥ Flow: Determine where you want to receive signals from:
○ Both: Weights from this indicator and the connected indicator will apply
○ Indicator only: Only weights from this indicator will apply
○ Input only: Only weights from the connected indicator will apply
• ⥅ Weight multiplier: Multiply all weights in the entire indicator by a given factor, useful for quickly testing different indicators in a granular setup.
• ⥇ Threshold: Set a threshold to indicate the minimum amount of weight it should receive to pass it through to the next indicator.
• ⥱ Limiter: Set a hard limit to the maximum amount of weight that can be fed through the indicator.
■ Connectable indicators - Weight scoring settings
▢ Weight scoring conditions
• SM – Signal mode: Enable specific conditions for weight scoring
○ All: All signals will be scored.
○ Entries only: Only entries will score.
○ Exits only: Only exits will score.
○ Entries & exits: Both entries and exits will score.
○ Zone: Continuous scoring for each candle within the zone.
• SP – Signal period: Defines a range of candles within which a signal can score.
• SC - Signal count: Specifies the number of bars to retrospectively examine and score.
○ Single: Score for a single occurrence
○ All occurrences: Score for all occurrences
○ Single + Threshold: Score for single occurrences within the signal period (SP)
○ Every + Threshold: Score for all occurrences within the signal period (SP)
▢ Weight scoring direction
• ES: Enter Short weight
• XL: Exit long weight
• EL: Enter Long weight
• XS: Exit Short weight
▢ Weight scoring values
• Weights can hold either positive or negative scores. Positive weights enhance a particular trading direction, while negative weights diminish it.
█ KDJ - INDICATOR SETTINGS
■ Main settings
• Enable/Disable Indicator: Toggle the entire indicator on or off.
• S - Source: Choose an alternative data source for the KDJ calculation.
• T - Timeframe: Select an alternative timeframe for the KDJ calculation.
• P - Period: Define the number of bars or periods used in the KDJ calculation.
• SL - Signal line: Adjust the smoothing factor for the KDJ's J line. This not only offers clearer buy/sell cues by reducing market noise but also determines the precise points for potential crossovers and crossunders.
■ Scoring functionality
• The KDJ scores long entries when the J line crosses over the signal (SL) line.
• The KDJ scores long exits when the J line crosses under the signal (SL) line after a prior crossover.
• The KDJ scores long zones the entire time the J line is above the signal (SL) line.
• The KDJ scores short entries when the J line crosses under the signal (SL) line.
• The KDJ scores short exits when the J line crosses over the signal (SL) line after a prior crossunder.
• The KDJ scores short zones the entire time the J line is below the signal (SL) line.
█ PLOTTING
• Standard: Symbols (EL, XS, ES, XL) appear relative to candles based on set conditions. Their opacity and position vary with weight.
• Conditional Settings: A larger icon appears if global conditions are met. For instance, with a Threshold(⥇) of 12, Signal Period (SP) of 3, and Scoring Condition (SC) set to "EVERY", an KDJ signaling over two times in 3 candles (scoring 6 each) triggers a larger icon.
█ USAGE OF CONNECTABLE INDICATORS
■ Connectable chaining mechanism
Connectable indicators can be connected directly to the signal monitor, signal filter or strategy , or they can be daisy chained to each other while the last indicator in the chain connects to the signal monitor, signal filter or strategy. When using a signal filter you can chain the filter to the strategy input to make your chain complete.
• Direct chaining: Connect an indicator directly to the signal monitor, signal filter or strategy through the provided inputs (→).
• Daisy chaining: Connect indicators using the indicator input (→). The first in a daisy chain should have a flow (⌥) set to 'Indicator only'. Subsequent indicators use 'Both' to pass the previous weight. The final indicator connects to the signal monitor, signal filter, or strategy.
■ Set up this indicator with a signal filter and strategy
The indicator provides visual cues based on signal conditions. However, its weight system is best utilized when paired with a connectable signal filter, signal monitor, or strategy .
Let's connect the KDJ to a connectable signal filter and a strategy :
1. Load all relevant indicators
• Load KDJ / Connectable
• Load Signal filter / Connectable
• Load Strategy / Connectable
2. Signal Filter: Connect the KDJ to the Signal Filter
• Open the signal filter settings
• Choose one of the three input dropdowns (1→, 2→, 3→) and choose : KDJ / Connectable: Signal Connector
• Toggle the enable box before the connected input to enable the incoming signal
3. Signal Filter: Update the filter signals settings if needed
• The default settings of the filter enable EL (Enter Long), XL (Exit Long), ES (Enter Short) and XS (Exit Short).
4. Signal Filter: Update the weight threshold settings if needed
• All connectable indicators load by default with a score of 6 for each direction (EL, XL, ES, XS)
• By default, weight threshold (TH) is set at 5. This allows each occurrence to score, as the default score in each connectable indicator is 1 point above the threshold. Adjust to your liking.
5. Strategy: Connect the strategy to the signal filter in the strategy settings
• Select a strategy input → and select the Signal filter: Signal connector
6. Strategy: Enable filter compatible directions
• Set the signal mode of the strategy to a compatible direction with the signal filter.
Now that everything is connected, you'll notice green spikes in the signal filter representing long signals, and red spikes indicating short signals. Trades will also appear on the chart, complemented by a performance overview. Your journey is just beginning: delve into different scoring mechanisms, merge diverse connectable indicators, and craft unique chains. Instantly test your results and discover the potential of your configurations. Dive deep and enjoy the process!
█ BENEFITS
• Adaptable Modular Design: Arrange indicators in diverse structures via direct or daisy chaining, allowing tailored configurations to align with your analysis approach.
• Streamlined Backtesting: Simplify the iterative process of testing and adjusting combinations, facilitating a smoother exploration of potential setups.
• Intuitive Interface: Navigate TradingView with added ease. Integrate desired indicators, adjust settings, and establish alerts without delving into complex code.
• Signal Weight Precision: Leverage granular weight allocation among signals, offering a deeper layer of customization in strategy formulation.
• Advanced Signal Filtering: Define entry and exit conditions with more clarity, granting an added layer of strategy precision.
• Clear Visual Feedback: Distinct visual signals and cues enhance the readability of charts, promoting informed decision-making.
• Standardized Defaults: Indicators are equipped with universally recognized preset settings, ensuring consistency in initial setups across different types like momentum or volatility.
• Reliability: Our indicators are meticulously developed to prevent repainting. We strictly adhere to TradingView's coding conventions, ensuring our code is both performant and clean.
█ COMPATIBLE INDICATORS
Each indicator that incorporates our open-source 'azLibConnector' library and adheres to our conventions can be effortlessly integrated and used as detailed above.
For clarity and recognition within the TradingView platform, we append the suffix ' / Connectable' to every compatible indicator.
█ COMMON MISTAKES, CLARIFICATIONS AND TIPS
• Removing an indicator from a chain: Deleting a linked indicator and confirming the "remove study tree" alert will also remove all underlying indicators in the object tree. Before removing one, disconnect the adjacent indicators and move it to the object stack's bottom.
• Point systems: The azLibConnector provides 500 points for each direction (EL: Enter long, XL: Exit long, ES: Enter short, XS: Exit short) Remember this cap when devising a point structure.
• Flow misconfiguration: In daisy chains the first indicator should always have a flow (⌥) setting of 'indicator only' while other indicator should have a flow (⌥) setting of 'both'.
• Hide attributes: As connectable indicators send through quite some information you'll notice all the arguments are taking up some screenwidth and cause some visual clutter. You can disable arguments in Chart Settings / Status line.
• Layout and abbreviations: To maintain a consistent structure, we use abbreviations for each input. While this may initially seem complex, you'll quickly become familiar with them. Each abbreviation is also explained in the inline tooltips.
• Inputs: Connecting a connectable indicator directly to the strategy delivers the raw signal without a weight threshold, meaning every signal will trigger a trade.
█ A NOTE OF GRATITUDE
Through years of exploring TradingView and Pine Script, we've drawn immense inspiration from the community's knowledge and innovation. Thank you for being a constant source of motivation and insight.
█ RISK DISCLAIMER
Azullian's content, tools, scripts, articles, and educational offerings are presented purely for educational and informational uses. Please be aware that past performance should not be considered a predictor of future results.

Asset capital flows - multi-timeframeIndicator for use on the any timeframe to show net capital flows into an asset of your choosing, to allow the user to track potential buy and selling pressure.
Net volume is derived from lower timeframe data (5 minute chart by default for daily timeframe) and multiplied by the average price for the same LTF period (defined by the mean of the high, low + close values). This gives the net capital inflow or outflow for the asset per bar. The cumulative sum of all previous bars is also calculated each period/day and available to be plotted as a line chart.
This might be preferred to other similar indicators as it uses low time frame bars to calculate the up/down volumes and price, thus accuracy is improved.
It should be borne in mind that the values of capital flows displayed are specific to the asset and the volume/price feed origin (ie the listed exchange used), and thus correlated with the total underlying flows, but there are other external factors influencing the volume/price data feed beyond the buy/sell volume of the specified exchange (such as spot and futures trading on other locations/exchanges)

LV Stock Valuation by Benjamin Graham's FormulaBenjamin Graham's stock valuation formula for growth companies is based on the principle that a stock is a part of a business, and that by analyzing the fundamentals of any company in the stock market, you should be able to derive its intrinsic value independent from its current stock price. Graham suggests that over the long-term, the stock price of a company and its intrinsic/fair value will converge towards each other until the stock price reflects the true value of the company. Finally, Graham recommends that after estimating the intrinsic value of a stock, investors should always purchase the stock with a "margin of safety," to protect oneself from assumptions and potential errors made in the valuation process.
Graham's stock valuation formula to calculate intrinsic value was originally shown in the 1962 edition of Security Analysis as follows:
V = EPS * (8.5 + 2g)
where:
V = intrinsic value per share (over the next 7-10 years)
EPS = earnings per share (over the trailing twelve months (TTM))
8.5 = price-to-earnings (P/E) base for a no-growth company
g = reasonably expected annual growth rate (over the next 7-10 years)
In 1974, Graham revised this formula, as published in The Intelligent Investor, to include a discount rate (aka required rate of return). This was after he concluded that the greatest contributing to stock values and prices over the past decade had been due to interest rates.
Graham's current stock valuation formula is shown below:
V = (EPS * (8.5 + 2g) * Z) / Y
where:
V = intrinsic value per share (over the next 7-10 years)
EPS = diluted earnings per share (over the trailing twelve months (TTM))
8.5 = price-to-earnings (P/E) base for a no-growth company (you can change it manually)
g = reasonably expected annual growth rate (calculated by 5-Yr EPS CAGR%) (you can change year period)
Z = average yield of XXX Bonds (4.4 is default on Graham's formula)
Y = current yield of XXX Bonds
Current bond yield values (Z and Y) are selected as an example from Turkey. You need to change it according to the country of stocks.
Buy price (BP) = Intrinsic value per share * (1 - Margin of safety %)
Margin of safety = selected 20% (you need to change it to 0, if you don’t want to use margin of safety and to see intrinsic value)
Buy price > Current market price: Consider buying the stock, as the current market price appears to be undervalued.
Buy price < Current market price: Consider selling or not buying the stock, as the current market price appears to be overvalued.
Keep in mind that this buy/sell recommendation is purely based on Graham's stock valuation formula and the current market price, and ignores all other fundamental, news, and market factors investors should examine as well before making an investment decision.
Buy price is calculated for 5 different P/E values in the script.
1. with fixed P/E
2. with current P/E
3. with forward P/E
4. with sector P/E (optional)
5. with index P/E (optional)
You can also do calculations by using different growth rate by selecting that option.
Different type of moving averages is also included in the script as an option.
